What are the Applications of Converted Wave Seismic Surveys?
Lithological Classification and Prediction

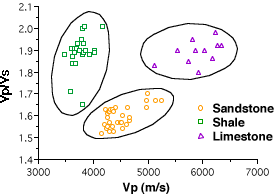
P-wave velocity (Vp) and shear-wave velocity (Vs) are determined using full-waveform sonic logs from four wells in the Medicine River Field in Alberta. A plot of Vp/Vs versus Vp shows the tendency of the data to form clusters which correlate to sandstone, shale and limestone lithologies.
Multiple seismic sections from one survey

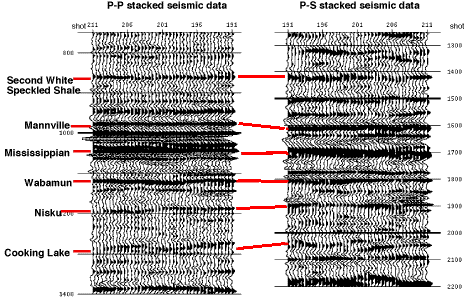
The data gathered from a converted-wave seismic survey is usually processed into two or three separate seismic sections: the P-P data, the P-Sv data and the P-Sh data. P-Sv refers to converted shear energy that is radially polarized, and P-Sh is shear energy polarized in a tangential direction, relative to the seismic line.
Shown here are a final processed P-P and P-Sv section, from Miller et. al.,
Interpretation and modelling of P-P and P-S seismic
data from Lousana, Alberta, CREWES Research Report Vol. 7, 1995, ch22
![]()
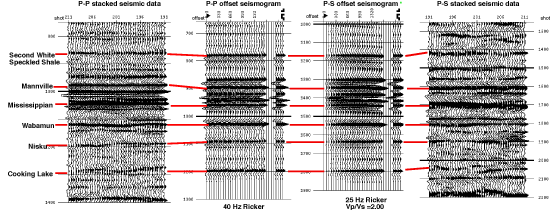
Correlation of P-P and P-S seismic data and synthetic seismograms

P-S data are plotted at 2/3 the scale of the P-P data. The P-S seismogram, generated using the P-wave sonic log and a constant Vp/Vs of 2.00, is then tied to the P-S data at the well location. The misties are due to the assumption of constant Vp/Vs. True interval Vp/Vs will vary depending on lithology.
From Miller, Susan L.M.: Multicomponent Seismic Data Interpretation, (M.Sc. thesis, 1996)
What else can we do with converted waves?
- Ground roll rejection
- Side-scanning seismic
- Multiple differences
- A new structural image
